Using Splunk to monitor pfSense Logs
In this article, we will explore how to extract log data from pfSense and send it to Splunk for further analysis.

This tutorial builds upon our earlier blog posts about Splunk and pfSense. Be sure to refer to my previous write-up, which details the installation and configuration steps.
Table of Content
1. Create firewall rule to collect pfSence logs
Log in to the pfSense Web Interface
Navigate to Firewall > Rules.
Click on Add rule as shown below to create a new rule.
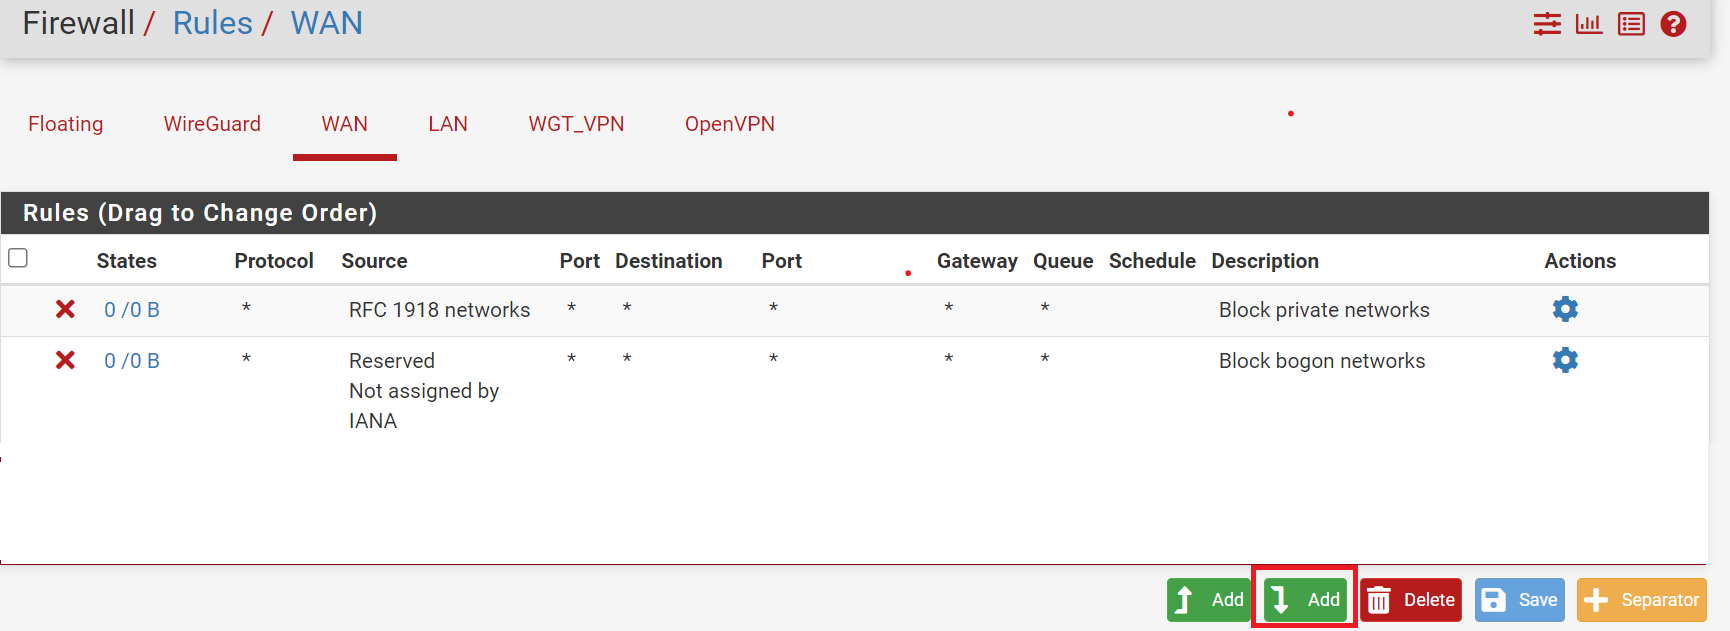
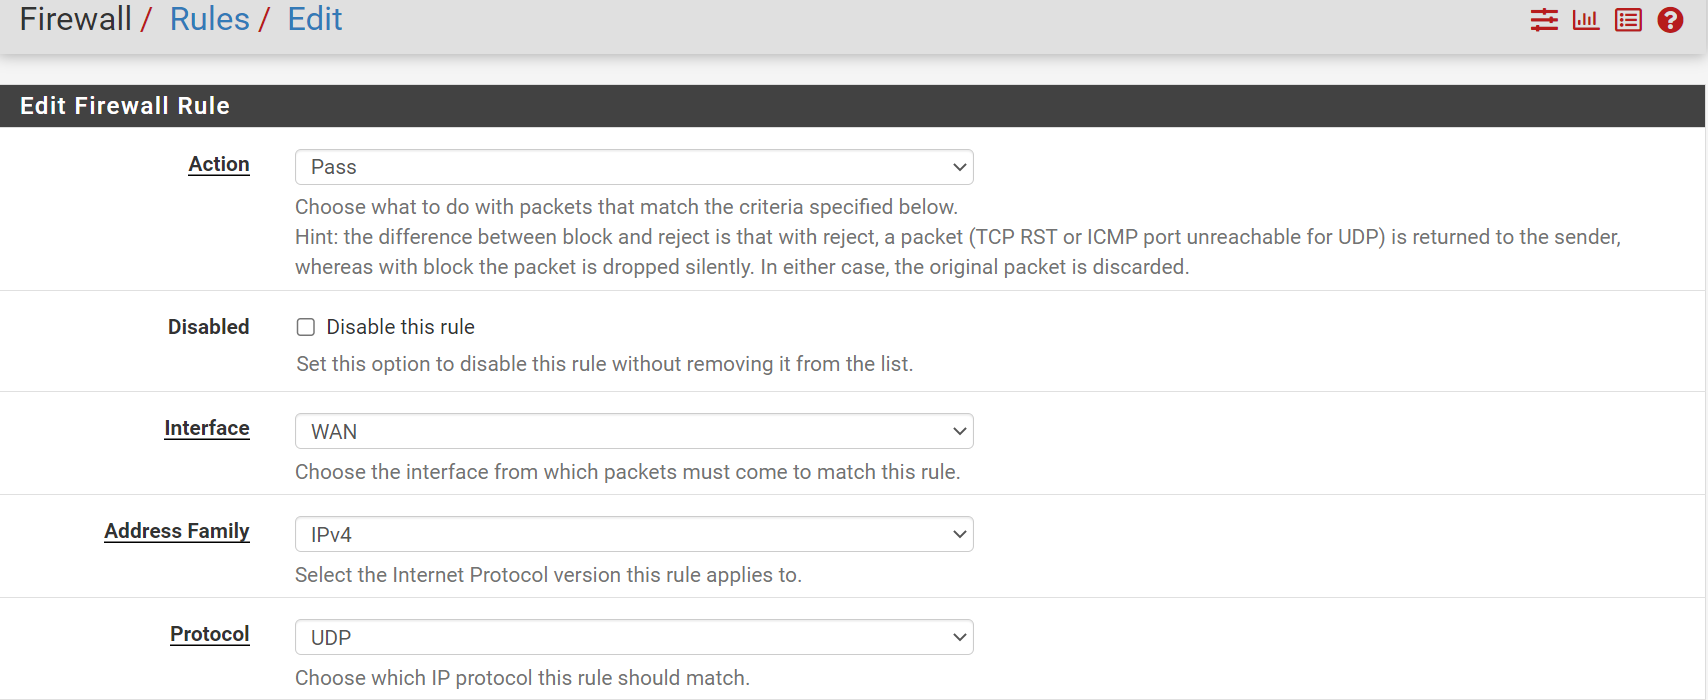
Change the settings the following:
Action : Pass
Interface: WAN (Choose the interface that you want to monitor)
Protocol: UDP
In the Destination Port Range field, enter 7001 as shown below.
In the Description field, enter a meaningful name for the rule (e.g. Allow UDP traffic on port 7001).
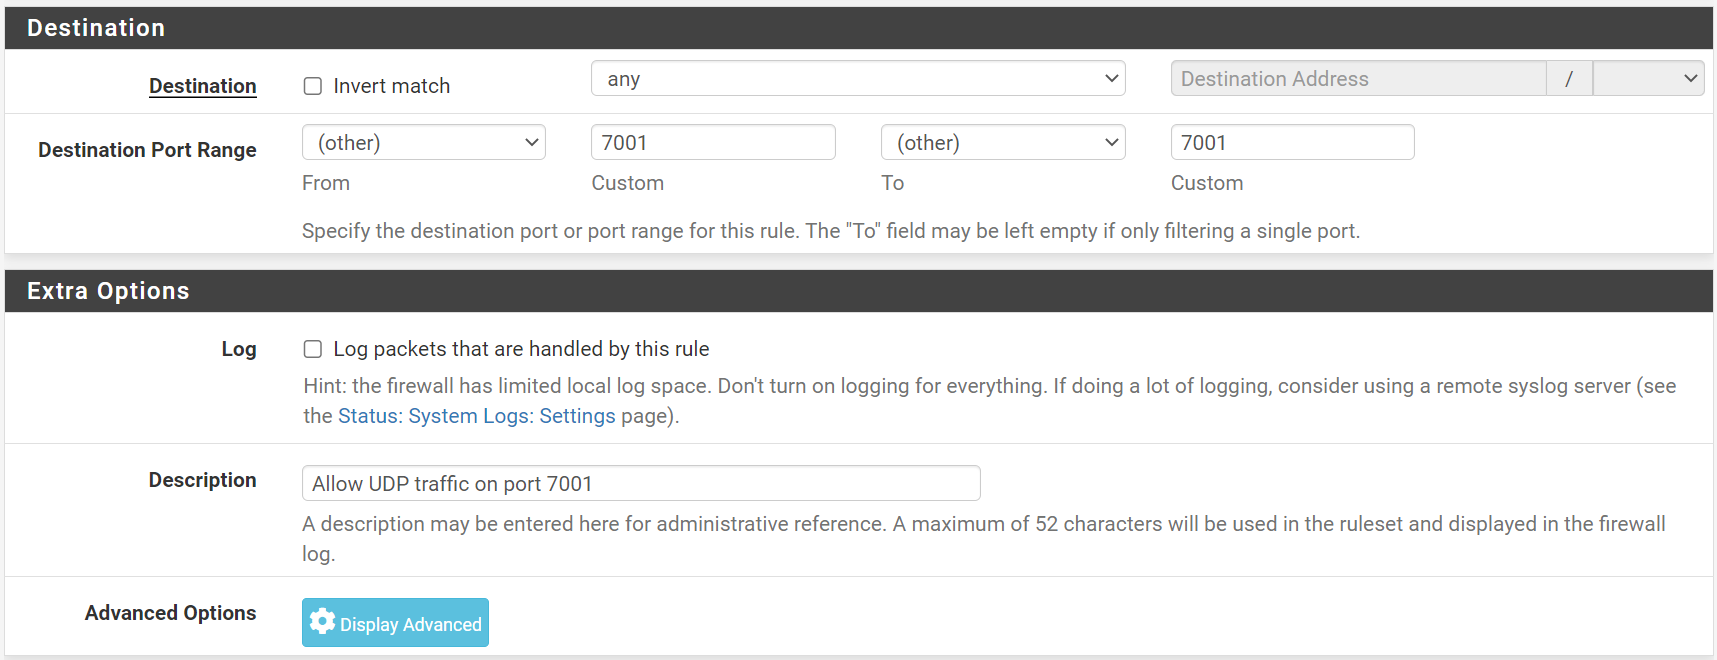
Click on Save to create the rule, and apply settings.
Once the firewall rule has been added, It should look similar to image below.
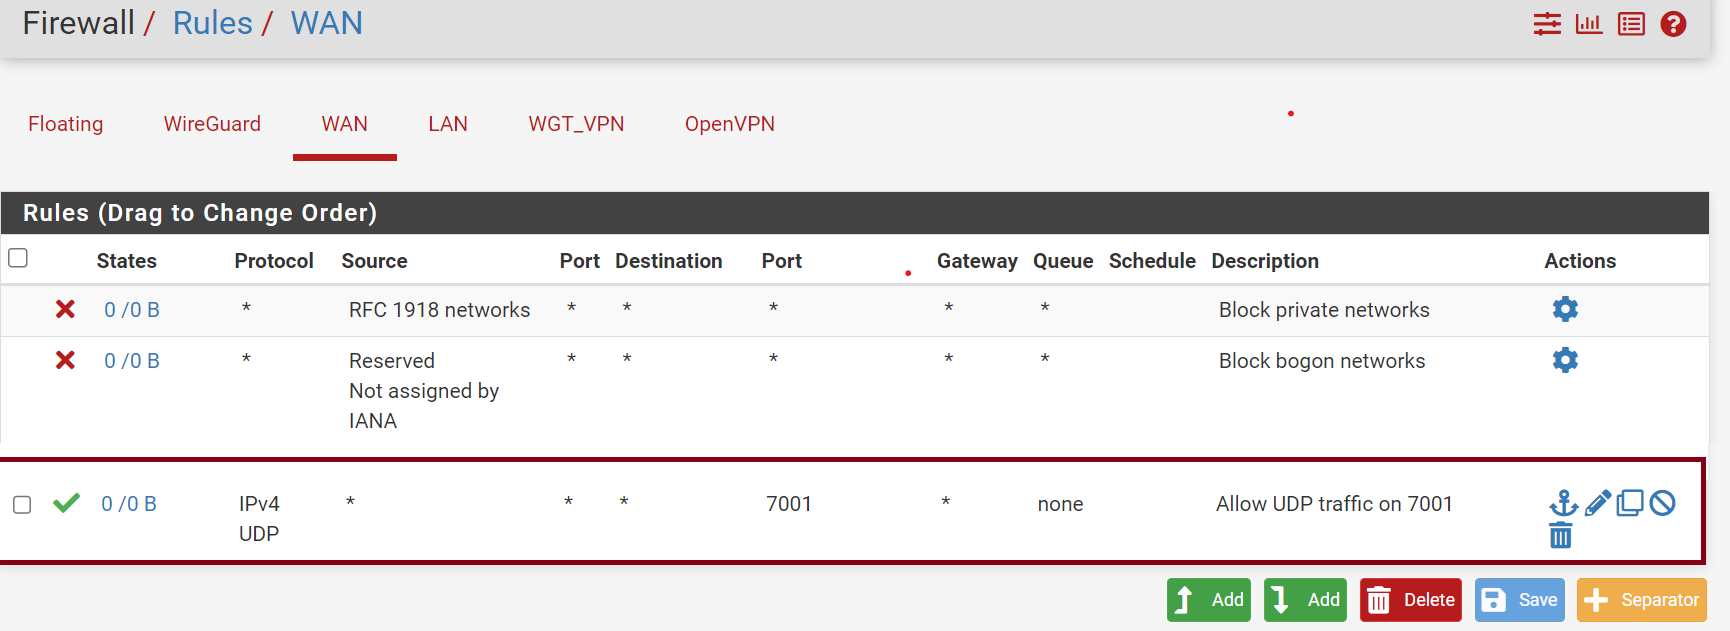
We have successfully created a firewall rule to allow IPv4 - UDP traffic to be passed on port 7001.
2. Create index configuration file
In Splunk, the indexes.conf file is a configuration file that is used to define the behaviour and settings of the different indexes that are used to store data. This file is located in the /opt/splunk/etc/system/local/ directory.
More about Indexes.conf file
The indexes.conf file contains a list of stanzas, where each stanza corresponds to a specific index. Within each stanza, we can define various parameters that control the behavior of the index. Some of the common parameters that can be set in the indexes.conf file include:
- Path: Specifies the location on disk where the index data will be stored.
- MaxDataSize: Specifies the maximum size of data that can be stored in the index.
- HomePath: Specifies the location on disk where the metadata for the index will be stored.
- FrozenTimePeriodInSecs: Specifies how long data should be kept in the index before it is frozen (i.e., made read-only).
- RepFactor: Specifies the number of copies of each bucket that should be stored for redundancy.
By editing the indexes.conf file, we can customize the settings for each index in order to optimize performance and ensure that data is stored in the most efficient way possible.
Create a indexes.conf file under /opt/splunk/etc/system/local/ directory with the flowing content.
- Navigate to directory
/opt/splunk/etc/system/local - Entre
nano index.conf - Copy and past the content below, then press Ctrl + O save the file and Ctrl + X to exit.
[fw]
homePath   = $SPLUNK_DB/fwdb/db
coldPath   = $SPLUNK_DB/fwdb/colddb
thawedPath = $SPLUNK_DB/fwdb/thaweddb
3. Create an inputs configuration file
Create input.conf file to collect the UDP syslog traffic from pfSense. We'll create a new App with a name Jay_inputs_fw to store inputs.conf configuration from our pfSense.
More about Inputs.conf file
The inputs.conf file in Splunk is a configuration file used to define and configure data inputs. It specifies how to collect data from various sources and what to do with that data.
Data inputs are the sources of data that Splunk indexes, such as log files, network ports, message queues, and scripted inputs. By configuring the inputs.conf file, we can specify the location, format, and type of data that Splunk should index.
The inputs.conf file contains stanzas, which are blocks of configuration settings that describe the input source. Each stanza typically defines the input type, such as file or UDP, and specifies the parameters for that input type, such as the file path, port number, or host name.
In addition to specifying data inputs, the inputs.conf file can also be used to configure various input-related settings, such as data parsing rules, event filtering, and index routing.
Overall, the inputs.conf file is a critical component of configuring data inputs in Splunk, allowing us to customize how your data is collected and processed to fit our specific use case.
Create directories as shown below:
mkdir /opt/splunk/etc/apps/jay_inputs_fwmkdir /opt/splunk/etc/apps/jay_inputs_fw/local
Navigate to newly created directory.
cd /opt/splunk/etc/apps/jay_inputs_fw/local
Create a input.conf configuration with the following content:
[udp://:7001]
index=fw
sourcetype=pfsense
Once file created, Splunk needs to be restarted to apply the settings.
/opt/splunk/bin/splunk restart
4. Enable remote log forward on pfSense
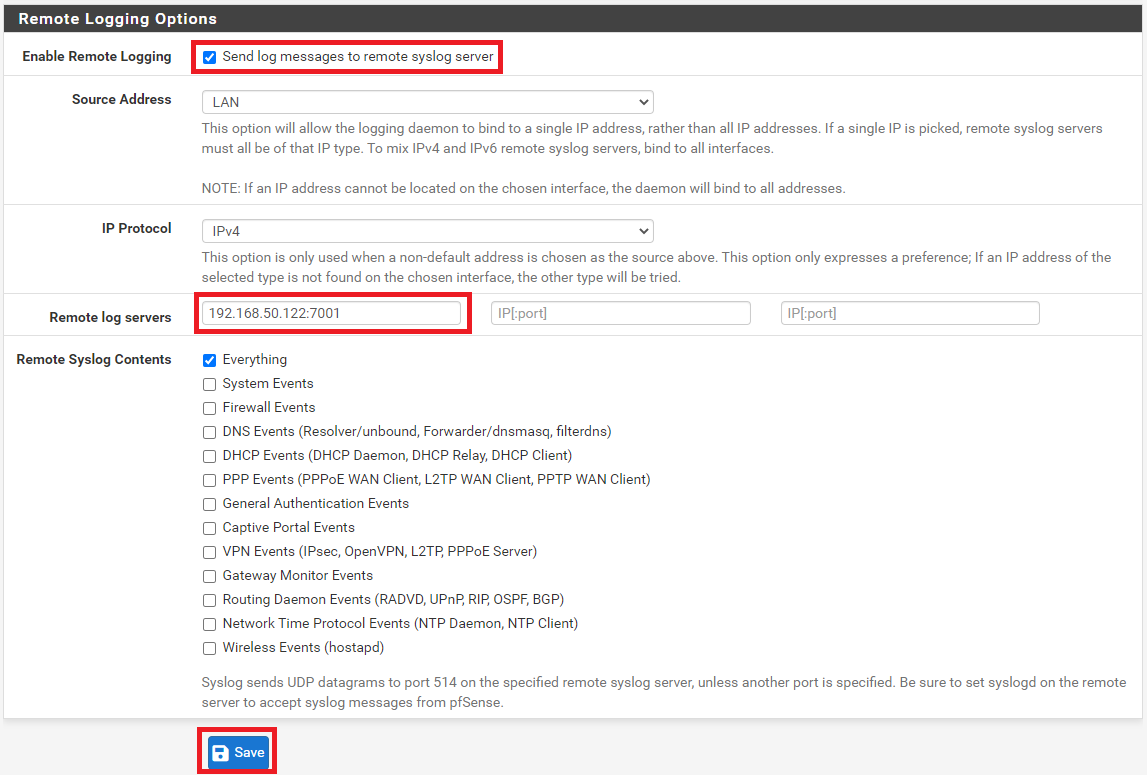
Navigate to Status > System Logs > Settings
Scroll down to Remote Logging Options, then tick to enable Remote Logging.
Entre the IP Address of the Splunk followed by port number on Remote log servers. (e.g. : <Splunk IP>: 7001)
Click on Save to enable log forwarding to Splunk server.
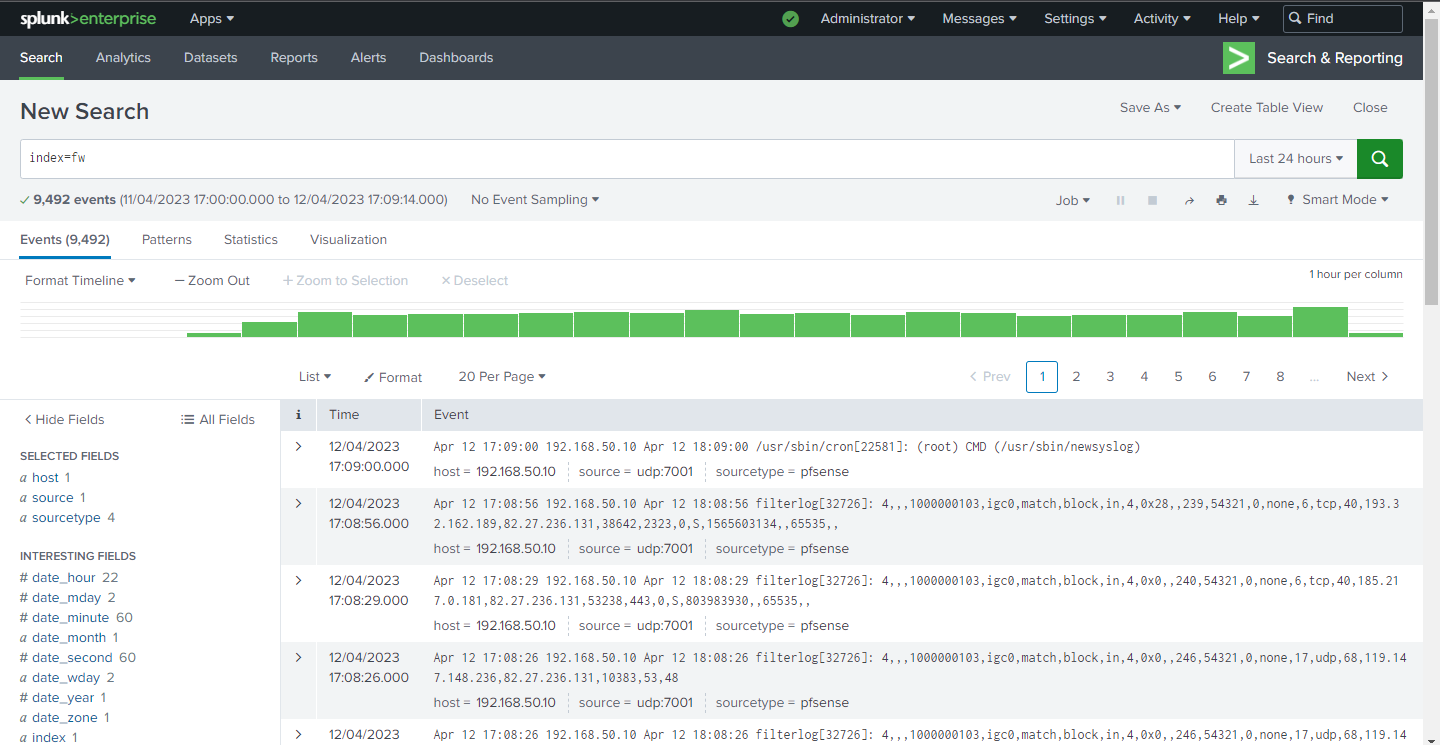
If we have configured everything correctly, we should able to see the logs generated in Splunk.
5. Parsing raw data thorugh Splunk Add-on.
We can see our logs are not parsed properly, in other words the key value pair is not defined and the data is difficult to read. However, we have Splunk Technical Add-On (TA) for pfSense in Splunkbase (Splunk software centre) to parse the data.
More about Parsed and Unparsed data
In Splunk, parsed logs refer to logs that have been processed and analysed by Splunk's parsing engine, which extracts the relevant fields and values from the log data and creates a structured format for it. Parsed logs are easier to work with, as they contain well-defined fields that can be searched, filtered, and analysed using Splunk's search processing language (SPL).
On the other hand, unparsed logs are logs that have not been processed by Splunk's parsing engine and are in their original raw format. Unparsed logs are more difficult to work with, as they require manual parsing and processing to extract the relevant information from them. Unparsed logs are generally less useful for search and analysis purposes than parsed logs.
Overall, parsed logs are typically preferred in Splunk because they provide more structured and searchable data, while unparsed logs may be used when working with non-standard or complex log formats that Splunk's parsing engine cannot handle.
We can download the TA-pfsense add-on below:
Download : TA-pfsense
After download, navigate to Apps > Manage Apps on Splunk web interface, then click on Install app from file to upload the downloaded add-on.

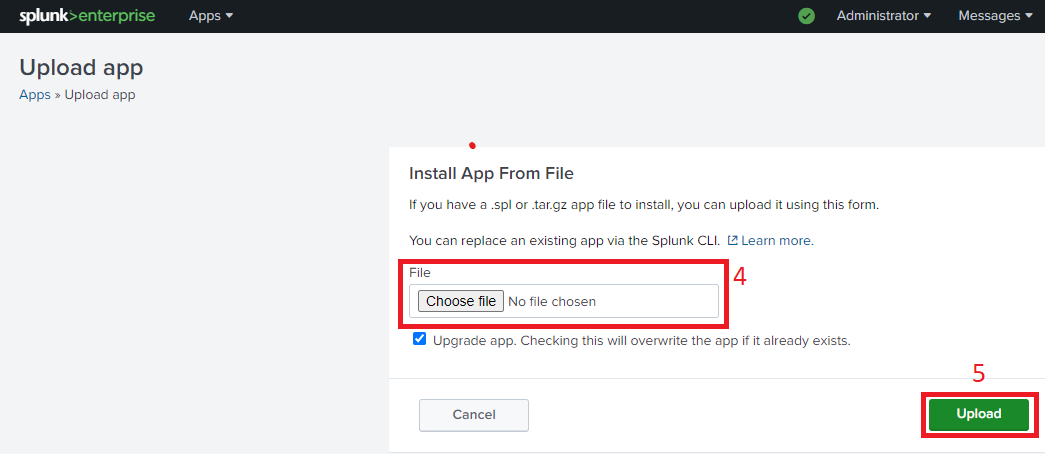
Once we have installed the TA-pfsense add-on, we can see all the filed has matching pairs for us to extract specific data from pfSense logs as shown below.
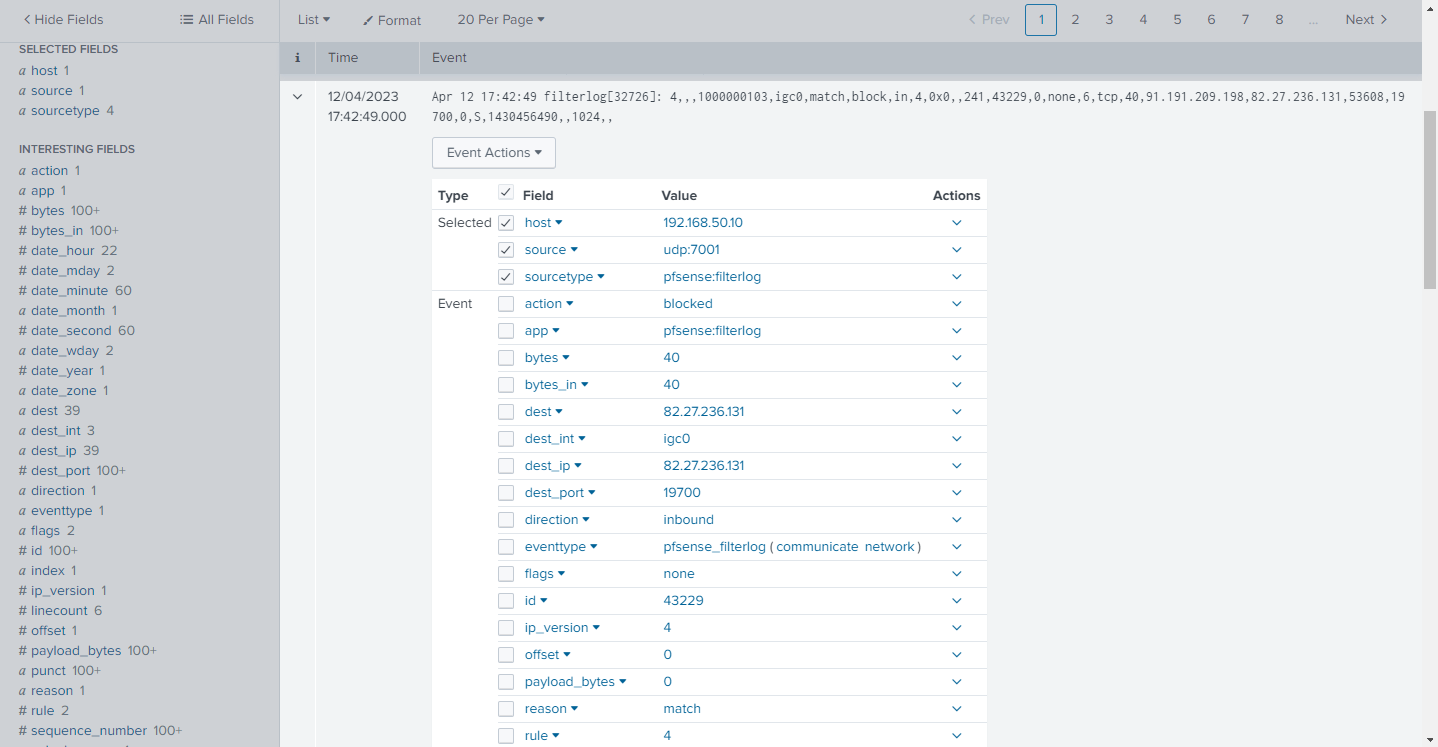
With everything set-up on Splunk Enterprise, we can make use powerful search function. The following search result shows the blocked traffics on firewall sorted by countries in descending order.
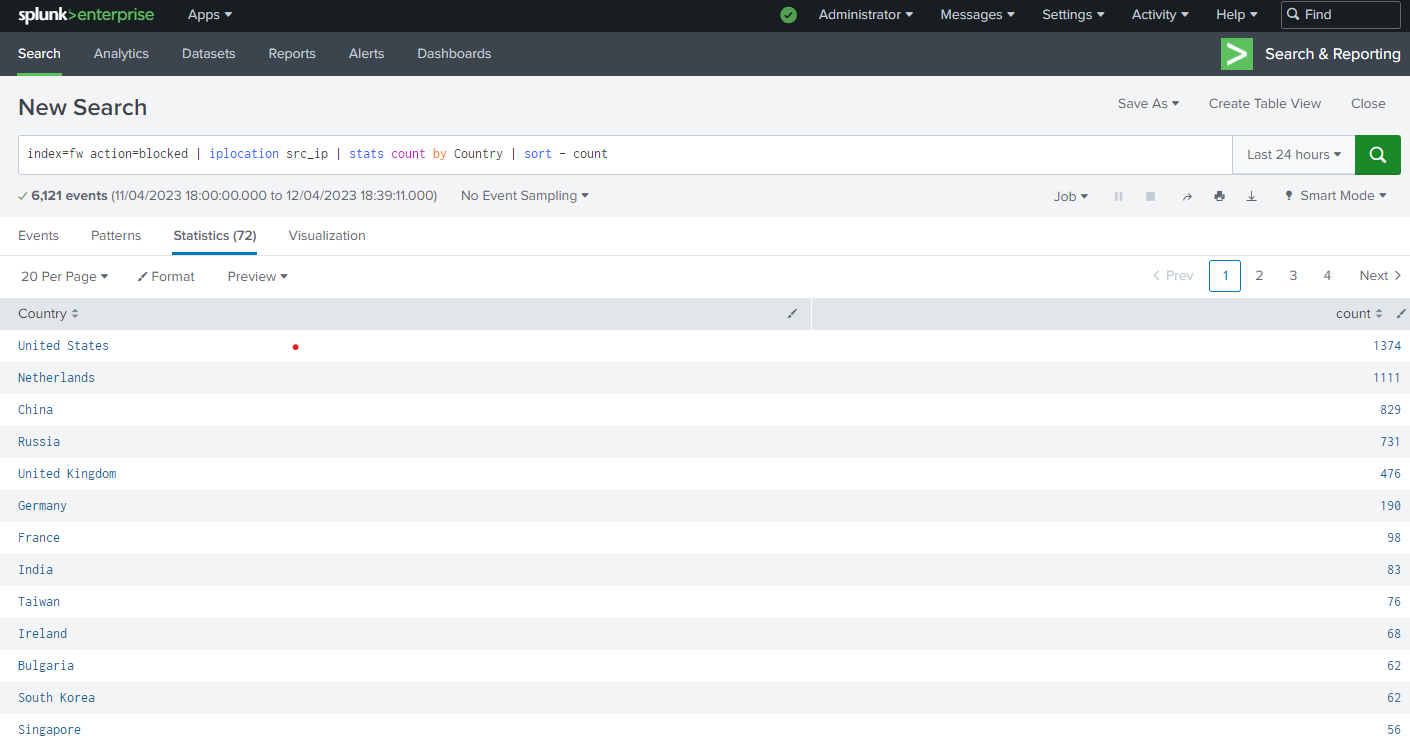
In future articles we will be looking at onboarding different logs data into Splunk and explore alerts and dashboards.
Member discussion